Plotting Points and Determining Azimuths
- trainlikearanger
- Apr 30, 2022
- 7 min read

Plotting Grid Coordinates
When plotting coordinates, maps are read RIGHT and UP. Think of it as you have to run (right) before you jump (up). Locations on the map can be determined by grid coordinates. The number of digits represents the degree of precision to which a point has been located and measured on a map. More digits mean the measurement is more precise.
General rule for a 1:50,000 large scale map:
4 coordinates: 1,000 m zone of accuracy
6 coordinates: 100 m zone of accuracy
8 coordinates: 10 m zone of accuracy
10 coordinates (rare): 1 m zone of accuracy
For land navigation, you will typically plot 8 digit coordinates.
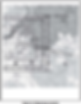
Grid squares- Grid squares divide the map by lines of measurement running north to south and east to west that intersect at 90 degrees. Each grid square typically represents 1000 m (1 km) of distance on large-scale maps.

Grid Coordinate Scales
Grid Coordinate Scales are found on military protractors. This tool divides grid squares accurately and is the primary tool for plotting grid coordinates. (See Figure 4-16.)

The grid coordinate scales divide the grid squares for more accurate measurements. We have drawn a circle and arrow to the grid coordinate scale typically used for land navigation (1:50,000 large-scale maps)
Plotting Points Using a Military Protractor (Coordinate Scale Tool)
In order to use the coordinate scale for determining grid coordinates, the map user has to make sure that the appropriate scale is being used on the corresponding map, and that the scale is right side up. To ensure the scale is correctly aligned, place it with the zero-zero point at the lower left corner of the grid square. Keeping the horizontal line of the scale directly on top of the east-west grid line, slide it to the right until the vertical line of the scale touches the point for which the coordinates are desired. (See Figure 4-18.)

In this example, the coordinates plotted, marked by the X, are 1421 8473 (8-digit grid and a 10 meter zone of accuracy).
Graphic (Bar) Scales
A graphic scale is a ruler printed on the map that is used to convert distances on the map to actual ground distances. The graphic scale is divided into two parts. To the right of the zero, the scale is marked in full units of measure and is called the primary scale. To the left of the zero, the scale is divided into tenths and is called the extension scale. Most maps have three or more graphic scales, each using a different unit of measure. (See Figure 5-2.) When using the graphic scale, be sure to use the correct scale for the unit of measure desired. In land nav, you will use kilometers and meters.
Note 1 km= 1000 m

Measuring Distance on The Map
Measuring Straight-Line Distance- To determine the straight-line distance between two points on a map, lay a straight-edged piece of paper on the map so that the edge of the paper touches both points and extends past them. Make a tick mark on the edge of the paper at each point. (See Figure 5-3.)

To convert the map distance to a measured ground distance, move the paper down to the graphic bar scale, and align the right tick mark (b) with a printed number in the primary scale so that the left tick mark (a) is in the extension scale. (See Figure 5-4.)
The primary scale provides the whole unit distance (in kilometers), while the extension scale provides the divided scale used to determine smaller increments of measure (in meters).

The primary scale is read from the zero mark to the right. In this example (b) is lined up with the 3 marking at least 3 km. However, there is more distance that is greater than 3 km but less than 4 km. To get an accurate measurement, the extension scale is used. The extension scale is numbered with zero at the right and increases to the left. (See Figure 5-4.) The color pattern on the extension scale is meant to break it down into incremental distances. In this example, each checkered box represents 100m increments. We see that the point at (a) is in the middle of the final checkered box (between the 900 m to 1000 m area). This means the distance past the 3km is approximately 950 m.
Note: Distances should be measured with as much accuracy as possible but are rarely 100% accurate. Do your best to measure as closely as you can, though some smaller increments (<100 m) may require an educated estimate.
What About Measuring Curved Routes Like a Road or Stream?
To measure distance along a road, stream, or other curved line, use a piece of paper and mark your start point on the edge of the paper. Align the edge of the paper along a straight portion and make a tick mark on both map and paper when the edge of the paper leaves the straight portion of the line being measured. (See A, Figure 5-5.) Keep the last tick mark in contact as you pivot the paper until another straight portion is lined up with the paper and make another tick mark. Repeat this process until the total distance is measured. When the distance is completely measured, move the paper to the graphic scale to determine the ground distance between the start point and end point. In the figure below, the only tick marks being measured are (a) and (b). The tick marks in between were used to keep track of the curves in the road. (See C, Figure 5-5.)

What if the Distance Exceeds the Scale?
There may be times when the distance being measured on the edge of the paper exceeds the graphic scale. In this case, tick marks may be used to keep track of the limits of the scale and slide the paper until the total measurements have been assessed.
Note: Distance measured on a map does not take into consideration the rise and fall of the land. All distances measured by using the map and graphic scales are flat distances. Therefore, the distance measured on a map increases when navigating on the ground, especially on hilly terrain. Measurements do not necessarily need to be adjusted, but this should be kept in mind when traveling to points.
Plotting Azimuths
The azimuth is the military method of expressing direction. Magnetic azimuths are determined by using magnetic instruments such as a compass. Grid azimuths are plotted between two points on a map. When an azimuth is plotted on a map, the points are joined by a straight line from the starting point (a) to the end point (b). A protractor is used to measure the angle and assess the grid azimuth
Protractor
The military protractor contains two scales: one in degrees (inner scale) and one in mils (outer scale). For land nav, we recommend you use degrees. The degree scale is graduated from 0 to 360 degrees, with each tick mark representing one degree. A line from 0 to 180 degrees is called the base line of the protractor. The index (or center) of the protractor is where the base line intersects the horizontal line, between 90 and 270 degrees. (See Figure 6-6.)

Using a Protractor to Measure Azimuths
Plot the grid coordinates and draw a straight line from your start point to end point. Be sure to use a straight edge to draw the line and extend beyond the end point to make sure the degree of the line intersects with the protractor. Note: distance of the line will not change the degree of the line.
Place the protractor on the map with the index mark at the center of mass of the start point, and the base line parallel to a north-south grid line.
Make a note of where the line intersects with the protractor. This is your grid azimuth
Note: Before using a compass, be sure to convert your grid azimuth to magnetic using the conversion instructions by the declination diagram in the margin of the map. More on this below.
(See Figure 6-4 below. The example given represents 99 degrees.).
Grid and Magnetic Azimuth Conversions
A declination diagram is part of the information in the lower margin on most larger maps. On medium-scale maps, the declination information is shown by a note in the map margin. Other map information includes the Grid-magnetic (G-M) angle. There is an angular difference between the grid north and the magnetic north. Since the location of magnetic north does not correspond exactly with the grid-north lines on the maps, a conversion from magnetic to grid or vice versa is needed.
The G-M angle diagram should be used each time the conversion of azimuth is required. This procedure is important when working with a map for the first time. When converting azimuths, exercise extreme care when adding and subtracting the G-M angle. A simple mistake of 1 degree could be significant in the field.
Note: Conversion of grid azimuths to magnetic azimuths and vice versa, depend on whether one is converting easterly or westerly G-M angles, the degree of declination change, and whether one is going from a magnetic azimuth to grid azimuth, or the opposite. (See Figure 6-8 and Table 6-1.) From an easterly magnetic azimuth to grid azimuth, one would add. To go from a grid azimuth to magnetic azimuth, one would subtract. (See Table 6-1.) z From a westerly magnetic azimuth to a grid azimuth, one would subtract. To go from a grid azimuth to a magnetic azimuth, one would add. (See Table 6-1.)

Note: There are no negative azimuths on the azimuth circle. Since 0 degree is the same as 360 degrees, then 2 degrees is the same as 362 degrees. This is because 2 degrees and 362 degrees are located at the same point on the azimuth circle. The grid azimuth can now be converted into a magnetic azimuth because the grid azimuth is now larger than the G-M angle. (See Table 6-1.)

References
Headquarters, Department of the Army. (2013). Map Reading and Land Navigation (FM 3-25.26).